Debugging things running in your emulator
Debugging what’s running inside an emulator
You’ve written an emulator, how do you debug anything running inside?
In this post I’ll try to describe what I did (and thought of doing), starting from the most crude methods.
Using the IDE and debug the emulator binary
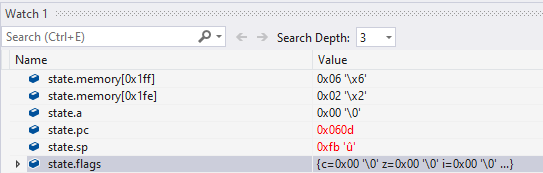
Here you can read the program state using just the IDE debugging facilities. Hopefully the code being debugged is simple enough that you can just correlate the (hopefully assembly) source listing to the disassembled instruction and view the machine state.
Here’s a screenshot of emu6502 running a program in Visual Studio:
Adding a monitor to the runtime
With emu6502 I just displayed the most important bits of the internal state. I got inspired by easy6502/6502js by skilldrick.
As the 6502 CPU has only five registers and a seven flags, it fits neatly to the side of the virtual screen and we can also add a disassembly of the instruction currently pointed by the program counter.
A=$00 X=$00 Y=$00
SP=$FB PC=$060D

NV-BDIZC
00100000

060D  A9 02     LDA #$02
Hacking together symbols
emuriscv also started life with a disassembly listing and showing the internal state, which worked just fine for developing and testing the instructions and simple programs.
When debugging the BBL bootloader, which is implemented in C, the disassembly and a PC pointer somewhere to the memory wasn’t terribly useful, as I had to check the disassembly with each step.
Using the disassembly
I wanted to know where the execution is in relative to the source C code. You can do just that using the debug information from the binary. When compiling with debug information with the GNU toolchain, you can extract the symbols with the disassembly with
objdump -dS BINARY
The listing looks like this:
80000584 <isstring>:

static inline int isstring(char c)
{
80000584:	fe010113          	addi	sp,sp,-32
80000588:	00812e23          	sw	s0,28(sp)
8000058c:	02010413          	addi	s0,sp,32
80000590:	00050793          	mv	a5,a0
80000594:	fef407a3          	sb	a5,-17(s0)
if (c >= 'A' && c <= 'Z')
80000598:	fef44703          	lbu	a4,-17(s0)
8000059c:	04000793          	li	a5,64
800005a0:	00e7fc63          	bgeu	a5,a4,800005b8 <isstring+0x34>
800005a4:	fef44703          	lbu	a4,-17(s0)
800005a8:	05a00793          	li	a5,90
800005ac:	00e7e663          	bltu	a5,a4,800005b8 <isstring+0x34>
    return 1;
800005b0:	00100793          	li	a5,1
800005b4:	07c0006f          	j	80000630 <isstring+0xac>
This was kind of better
Supporting the symbols directly in the emulator
There’s also an option to generate symbols with objdump:
objdump -t BINARY
It produces a listing of the symbols and their location in the memory, such as.
c0000068 l       .init.text	00000000 relocate
00000000 l    df *ABS*	00000000 main.c
c00000dc l     F .init.text	00000024 set_reset_devices
c0000100 l     F .init.text	00000028 debug_kernel
c0000128 l     F .init.text	00000028 quiet_kernel
c0000150 l     F .init.text	0000003c init_setup
To show which symbol the execution is happening, I hacked together a crude symbol mapping support into emuriscv. It needs a bit of Python to massage the symbol file into this:
current = add_symbol(current, 0x80400000, "_start");
current = add_symbol(current, 0x80400068, "relocate");
current = add_symbol(current, 0x804000dc, "set_reset_devices");
current = add_symbol(current, 0x80400100, "debug_kernel");
current = add_symbol(current, 0x80400128, "quiet_kernel");
current = add_symbol(current, 0x80400150, "init_setup");
Which fills the internal list of symbols:
typedef struct symbol symbol;

typedef struct symbol {
    word offset;
    char* name;
    symbol* next;
} symbol;

symbol* symbol_list;

symbol* add_symbol(symbol* tail, word offset, char* name);
symbol* get_symbol(symbol* symbols_head, word address);
Add a I’ve ended up having a crude debug display showing the current symbol for the PC location!
word* address = get_physical_address(state, state->pc);
symbol = get_symbol(symbol_list, state->pc);
printf("%08x:  %08x  ", state->pc, *address);
printf("%s  ", symbol->name);
Breakpoints and conditional breakpoints
Using the symbol map allows poor man’s breakpoints and triggers such as:
if (state->pc == 0xc000154c /* page_ref_dec_and_test */) {
			print_verbose = 1;
}

//if you're feeling fancy, can compare to the symbol name itself
if(!strcmp(symbol->name, "page_ref_dec_and_test"))
{
    ...
}
Otherwise one could still use the IDE breakpoints on various paths of execution.
Debugging by printing
Once some kind of console output works, you can use the equivalent of printf / printk function calls to reason about the code flow and internal state. There is a nice debugging by printing wiki page on how to use printk debugging in the kernel context.
printk sends a formatted string to a console driver (our riscv early console) calling a sbi_console_write, which will internally iterate over each character and send it over to the host system using sbi_console_putchar.
I have used the existing SBI (supervisor binary interface) in the kernel tree, it implements sbi_console_putchar to more or less as:
li a7, 1 #use the sbi_console_putchar function
li a0, $char_to_write #use the character
ecall
The implementation on emuriscv side lives in the ecall instruction handler:
#define SBI_CONSOLE_PUTCHAR 1
#define SBI_WHICH 17  //A7 = X11
#define SBI_ARG0_REG 10 //A0 = X10

if (state->x[SBI_WHICH] == SBI_CONSOLE_PUTCHAR) {
    char c = (char)state->x[SBI_ARG0_REG];
    fprintf(stderr, "%c", c);
}
Building on top of that, drivers/tty/serial/earlycon-riscv-sbi.c defines a console device that uses the sbi_console_putchar() as a serial device.
static void sbi_console_write(struct console *con,
			      const char *s, unsigned n)
{
	struct earlycon_device *dev = con->data;
	uart_console_write(&dev->port, s, n, sbi_putc);
}
Building an interactive monitor
QEMU offers a monitor that allows you to peek into the memory and evaluate simple expressions.
QEMU implements /x and /xp commands, which allow the user to show N bytes from a memory location (address, an address pointed to by a register) in various formats (hex, decimal, disassembly). The print command can evaluate an expression, which is pretty useful too.
# display 3 instructions on an x86 processor starting at the current instruction:
(qemu) xp /3i $eip
0x00006f01:  0e                       pushw    %cs
0x00006f02:  00 00                    addb     %al, (%bx, %si)
0x00006f04:  00 00                    addb     %al, (%bx, %si)

#print the result of an expression
(qemu) print /x $esp + $eax
0x6f7c
Something similar could be integrated by implementing a simple telnet server, handlie the commands from the connection handler, then use the existing disassembly / dump facilities for format the output.
I’ve implemented a simple QEMU-like monitor for emuriscv, details are in the separate article Writing a monitor console
Using a real debugger
This should be the most robust solution - allowing me to use a real IDE with a real debugger. I have been thinking about this for a while but haven’t actually started work on that.
There are tools such as gdbstub, which implements the GDB Remote Serial Protocol and should allow you to debug a target platform using GDB (or another application which supports remote GDB targets).
To actually get this running one would need to implement a couple of functions and compile gdbstub with the emulator itself, implementing the debug state and a couple of functions for reading/writing memory, reading registers, etc. - see the gdbstub x86 example. I’d also need to implement a virtual serial port over TCP to allow GDB to connect to the stub.